9. Weather
9.1. Wx/Notams
Weather for a specific AD may be accessed by tapping on the map near the waypoint of interest, tap on the waypoint in the resulting Closest Points popup, then tap Wx/Notmas (as illustrated in Image 2.3 on the Map Page). In some cases you may see a weather icon shortcut for the top result in the Closest Points popup. Tap this to achieve the same result.
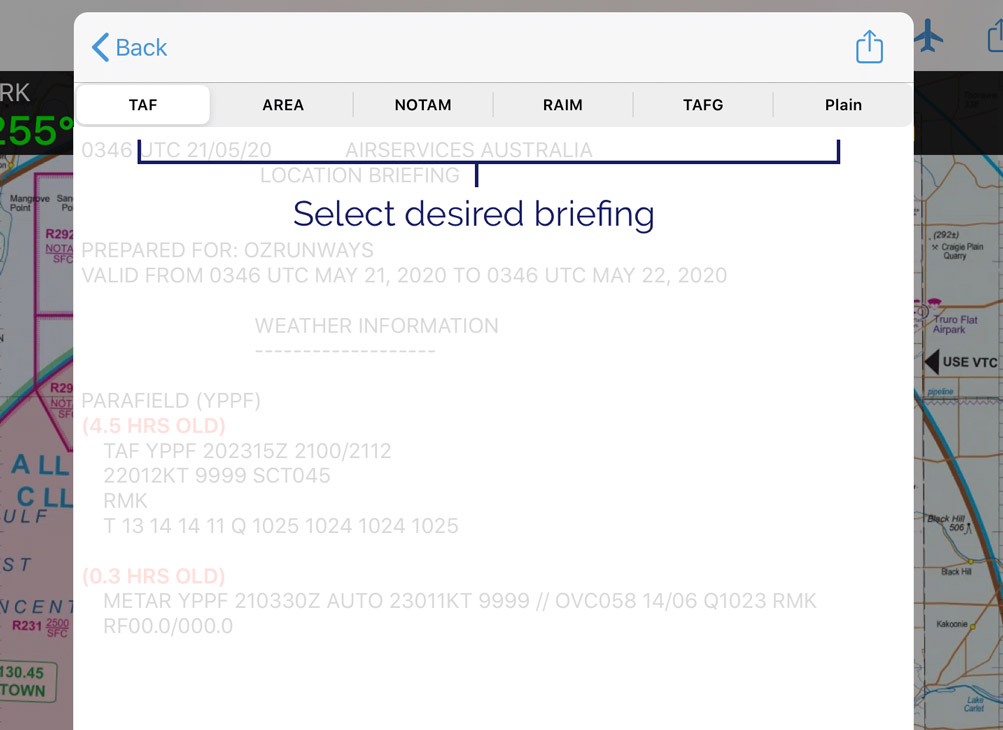
Image 9.1 Wx/Notams view
- eAWIS
Created from unverified one-minute observation data from BoM. For situational awareness only.
eAWIS by OzRunways uses the one-minute observation data from the Bureau of Meteorology, available at locations with an Aerodrome Weather Station. Presented similar to a METAR but updated every minute.
- TAF
If available, the TAF from the NAIPS Location Briefing for the selected location is displayed.
- Area Briefing
Displays the area briefing (including area NOTAMs) for the area which the selected waypoint is located within. This tab also has quick links to the GAF & GPWT charts for the area.
- NOTAM
If available, NOTAMs from the NAIPS Location Briefing for the selected location are displayed.
- RAIM
GPS RAIM prediction.
- TAFG
If there is a TAF for the selected location then this tab will display a graphical version (TAFG or TAFGRAF). In the TAFG display, the textual TAF is displayed in a scrollable window above the graphical TAF. Tapping on a graphical element will highlight the corresponding text in the TAF and popup a plain text explanation momentarily at the top of the graphical TAF window.

- Plain
Where a TAF is available, this tab will display a ‘Plain Text’ version e.g. no abbreviations are used, and times are in local timezone (as per the set device timezone). This format is experimental and should be only used for educational purposes.
Naturally, TAFs or NOTAMs are not displayed when an AD/ALA has none.
9.2. Weather Radar Overlay
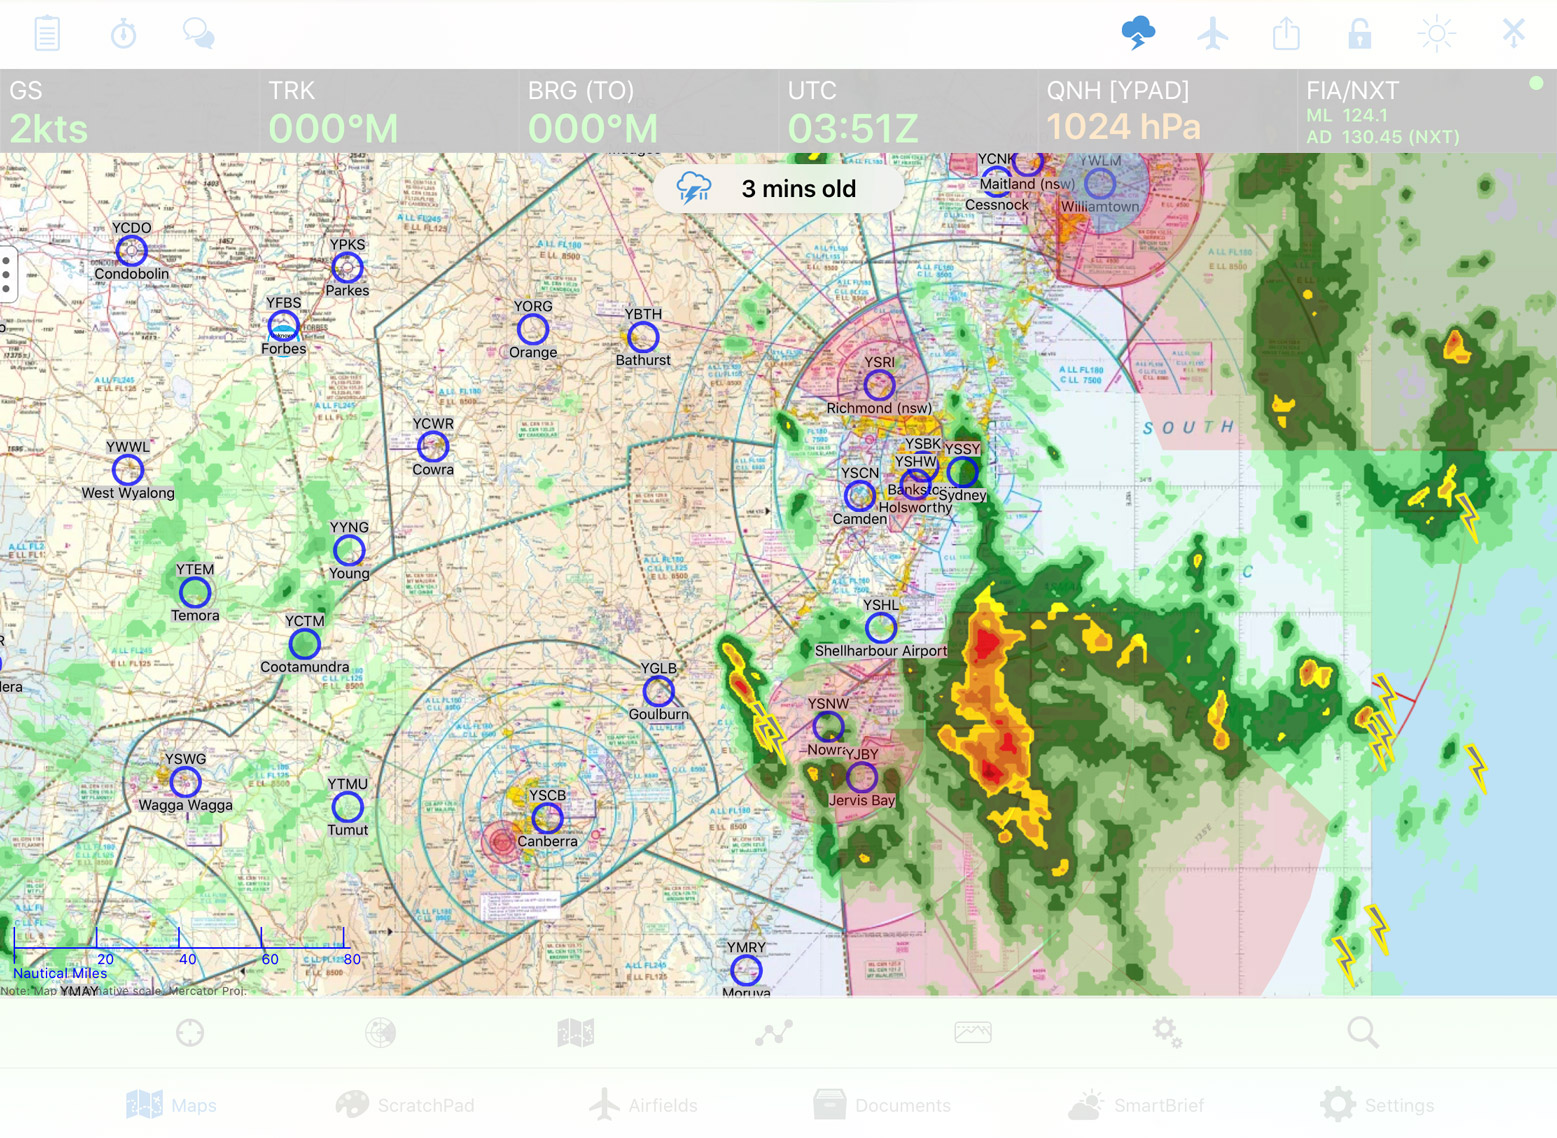
Image 9.2 Weather Radar Overlay
The Weather Overlay is a weather radar feed that is overlaid on whichever map you are viewing. The overlay shows rain, clouds and lightning.
When switching on the Weather Radar Overlay, the radar data will be fetched on-demand from the internet. Until the data can be loaded a set of boxes with red crosses are shown. As the data downloads the boxes will disappear and be replaced with the radar data. This makes it easy to distinguish between areas that have no weather, and areas where the data has not been downloaded yet.
Image 9.2 shows a typical overlay with both lightning and rain. The intensity of the rain is graded from light green, through yellow, to red, purple and eventually, white. There are three cycles of animation to show the direction of weather. Significant cloud overlays are also shown in grey. A table that shows colour to rainfall rate may be found at https://en.wikipedia.org/wiki/DBZ_(meteorology).
9.3. Aerodrome Weather
The NAIPS Location Briefing for an aerodrome can also be viewed when looking at a document pertaining to that aerodrome. This is described in the Plate Preference Toggle section of the Airfields chapter.
9.4. Windy / BoM Radars / Satellite View
These items are accessed by pressing the Radar button on the Map Page. Use the control in the top left corner to switch between Windy / BoM Radar / Satview
BoM is Bureau of Meteorology.
Windy.com
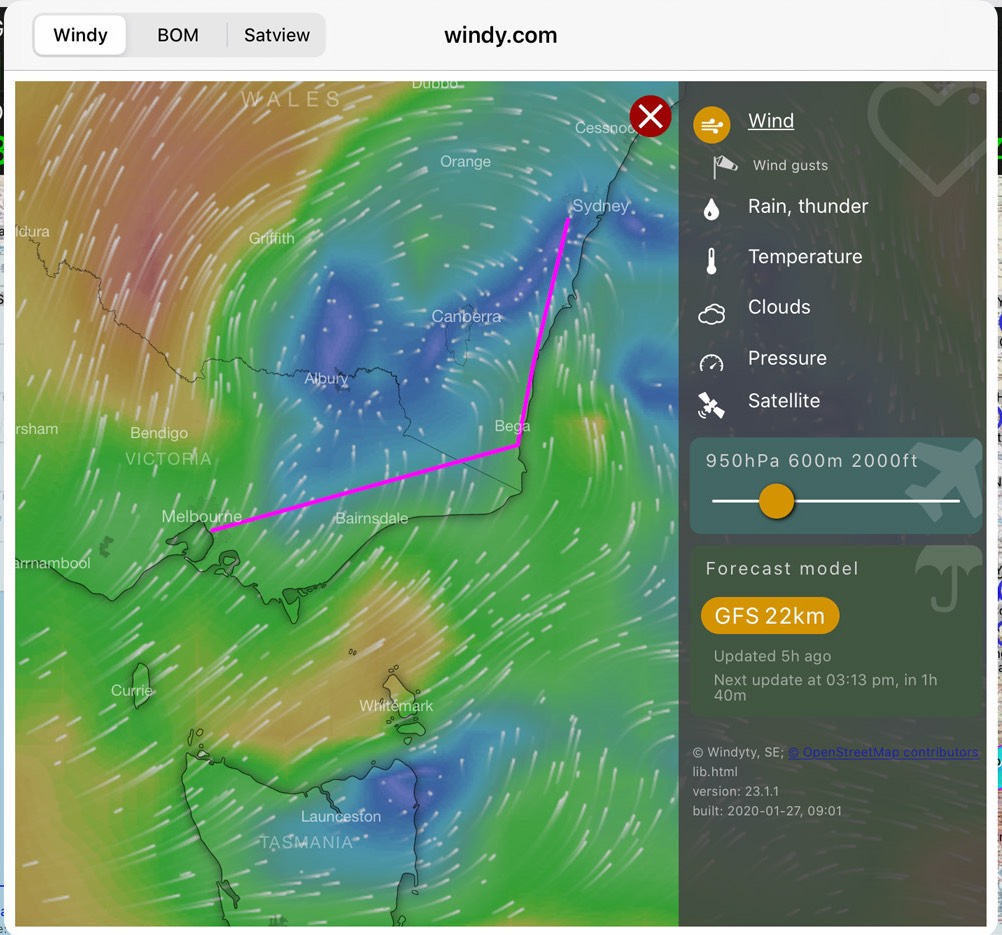
Image 9.3 Windy.com view
Windy is a forecast tool. The time of the forecast can be advanced using a menu at the bottom of the display. Wind, cloud, temperature, rain (and snow), and atmospheric pressure may be displayed (and forecast). In addition, where appropriate, the altitude may be set. Windy is a private company that accesses a publicly available weather database produced by worldwide weather agencies (including the BoM) that provides forecasts into the future on a grid basis (i.e. one latitude degree by one longitude degree).
The label in the top right hand corner shows what information is currently being overlaid on the map. Tap on the label to reveal more options. Here you can choose from a variety of overlays, and also adjust the forecast altitude and other settings. Tap on the Windy map and a picker will appear. This picker will show the exact weather at this point, depending on the displayed overlay. For example if the Wind overlay is enabled, the picker will show the wind direction and speed at this point.
BoM Radars
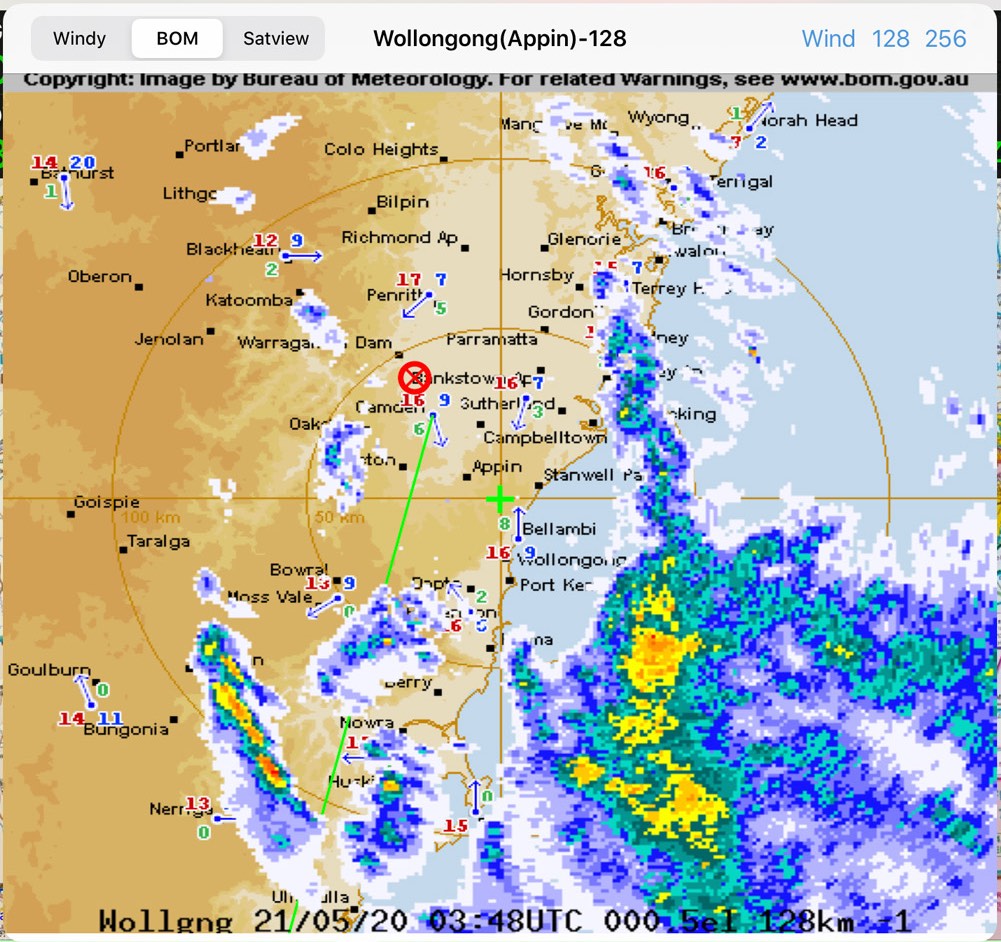
Image 9.4 BoM radar view
Displays the BoM radar closest to the centre position of the map screen. e.g. if you scroll the map to Melbourne City and then come into the BoM Radar view, you will see the Melbourne radar. The name of the radar you are currently viewing is displayed in the centre at the top. Use the controls in the top right corner to change resolution, or see the Doppler Wind. (These options may not be available on all radars.)
A list of BoM radar sites is available here: http://www.bom.gov.au/australia/radar/ If you notice a BoM radar is missing from the app please get in touch with us and we can add it in.
Satellite View
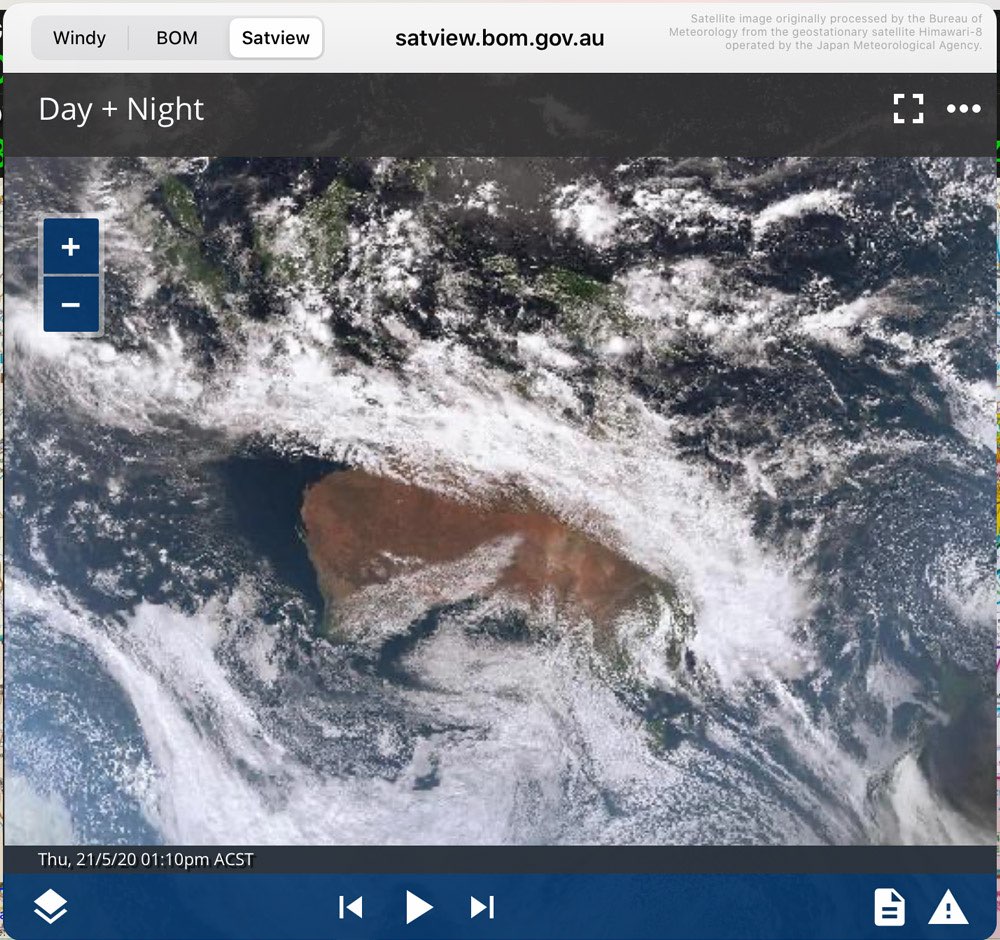
Image 9.5 Satellite view
This satellite view is from the Bureau of Meteorology website: http://satview.bom.gov.au Press the Play button to see the time lapse images, spaced 10 minutes apart for 4 hours. Selecting the Layers button in the bottom left hand corner enables you to activate multiple features such as Lightning, Cities, Roads, and more.
9.5. SmartBrief / Brief
SmartBrief is an interactive map that combines a variety of different weather sources. You can access the Graphical Area Forecasts (GAF), NAIPS location briefings, SIGMETs, AIRMETs, Grid Point Wind & Temperature (GPWT) and more. For more information about SmartBrief see the SmartBrief / Brief Page
9.6. PDF Pack
For a given plan you can generate a single PDF document containing the plan sheet, fuel plan, weight & balance, NOTAMs, aerodrome weather briefing and other weather charts.
You can find the PDF Pack on the Plan Details view in the Share/Export menu.