17. Graphic Overlays
Graphical overlays may be used for a variety of functions. For example, one application could be the display of power lines for safety or inspection reasons. Another application might be to indicate search and rescue patterns. Any time you need a semi-permanent geographically defined overlay on an OzRunways map, this functionality may be used. Overlays are specified in the KML (Keyhole Markup Language) language which is used by Google Earth for the specification of geographic data. It may be displayed and defined/entered in Google Earth. KML is summarised at the end of this chapter. The underlying KML language is not for the faint hearted and it is not expected that a pilot understand this format. Much of the information in the latter parts of this section is for IT types. The pilot should concentrate on how to access overlays (next section).
17.1. Opening and Displaying Graphic Overlays
The first step in the process is to get the KML file into OzRunways. This is achieved by emailing yourself a KML file. Open the email on the iPad and press and hold on the attachment icon. Then select the ‘Copy to Oz RWY’ option. This is the same for any other data you are importing into OzRunways. The KML file is copied into OzRunways and displayed. Tap on the KML Overlays icon (see KML Overlays in the Map Page section) to reveal a menu where you can switch the overlay on/off. When on, the KML file name will be highlighted in light green in the list, and white when off. Toggle the KML file off/on by tapping it.
Some subscriptions already include a pre-loaded list of KML files available to use. These appear in the KML Overlays menu underneath user imported KMLs (if any), for example in New Zealand the Department of Conservartion (DOC) Protected Areas.
Swipe (right-to-left) on any KML file in the list to reveal more options. You can delete the file, or share it with other users.
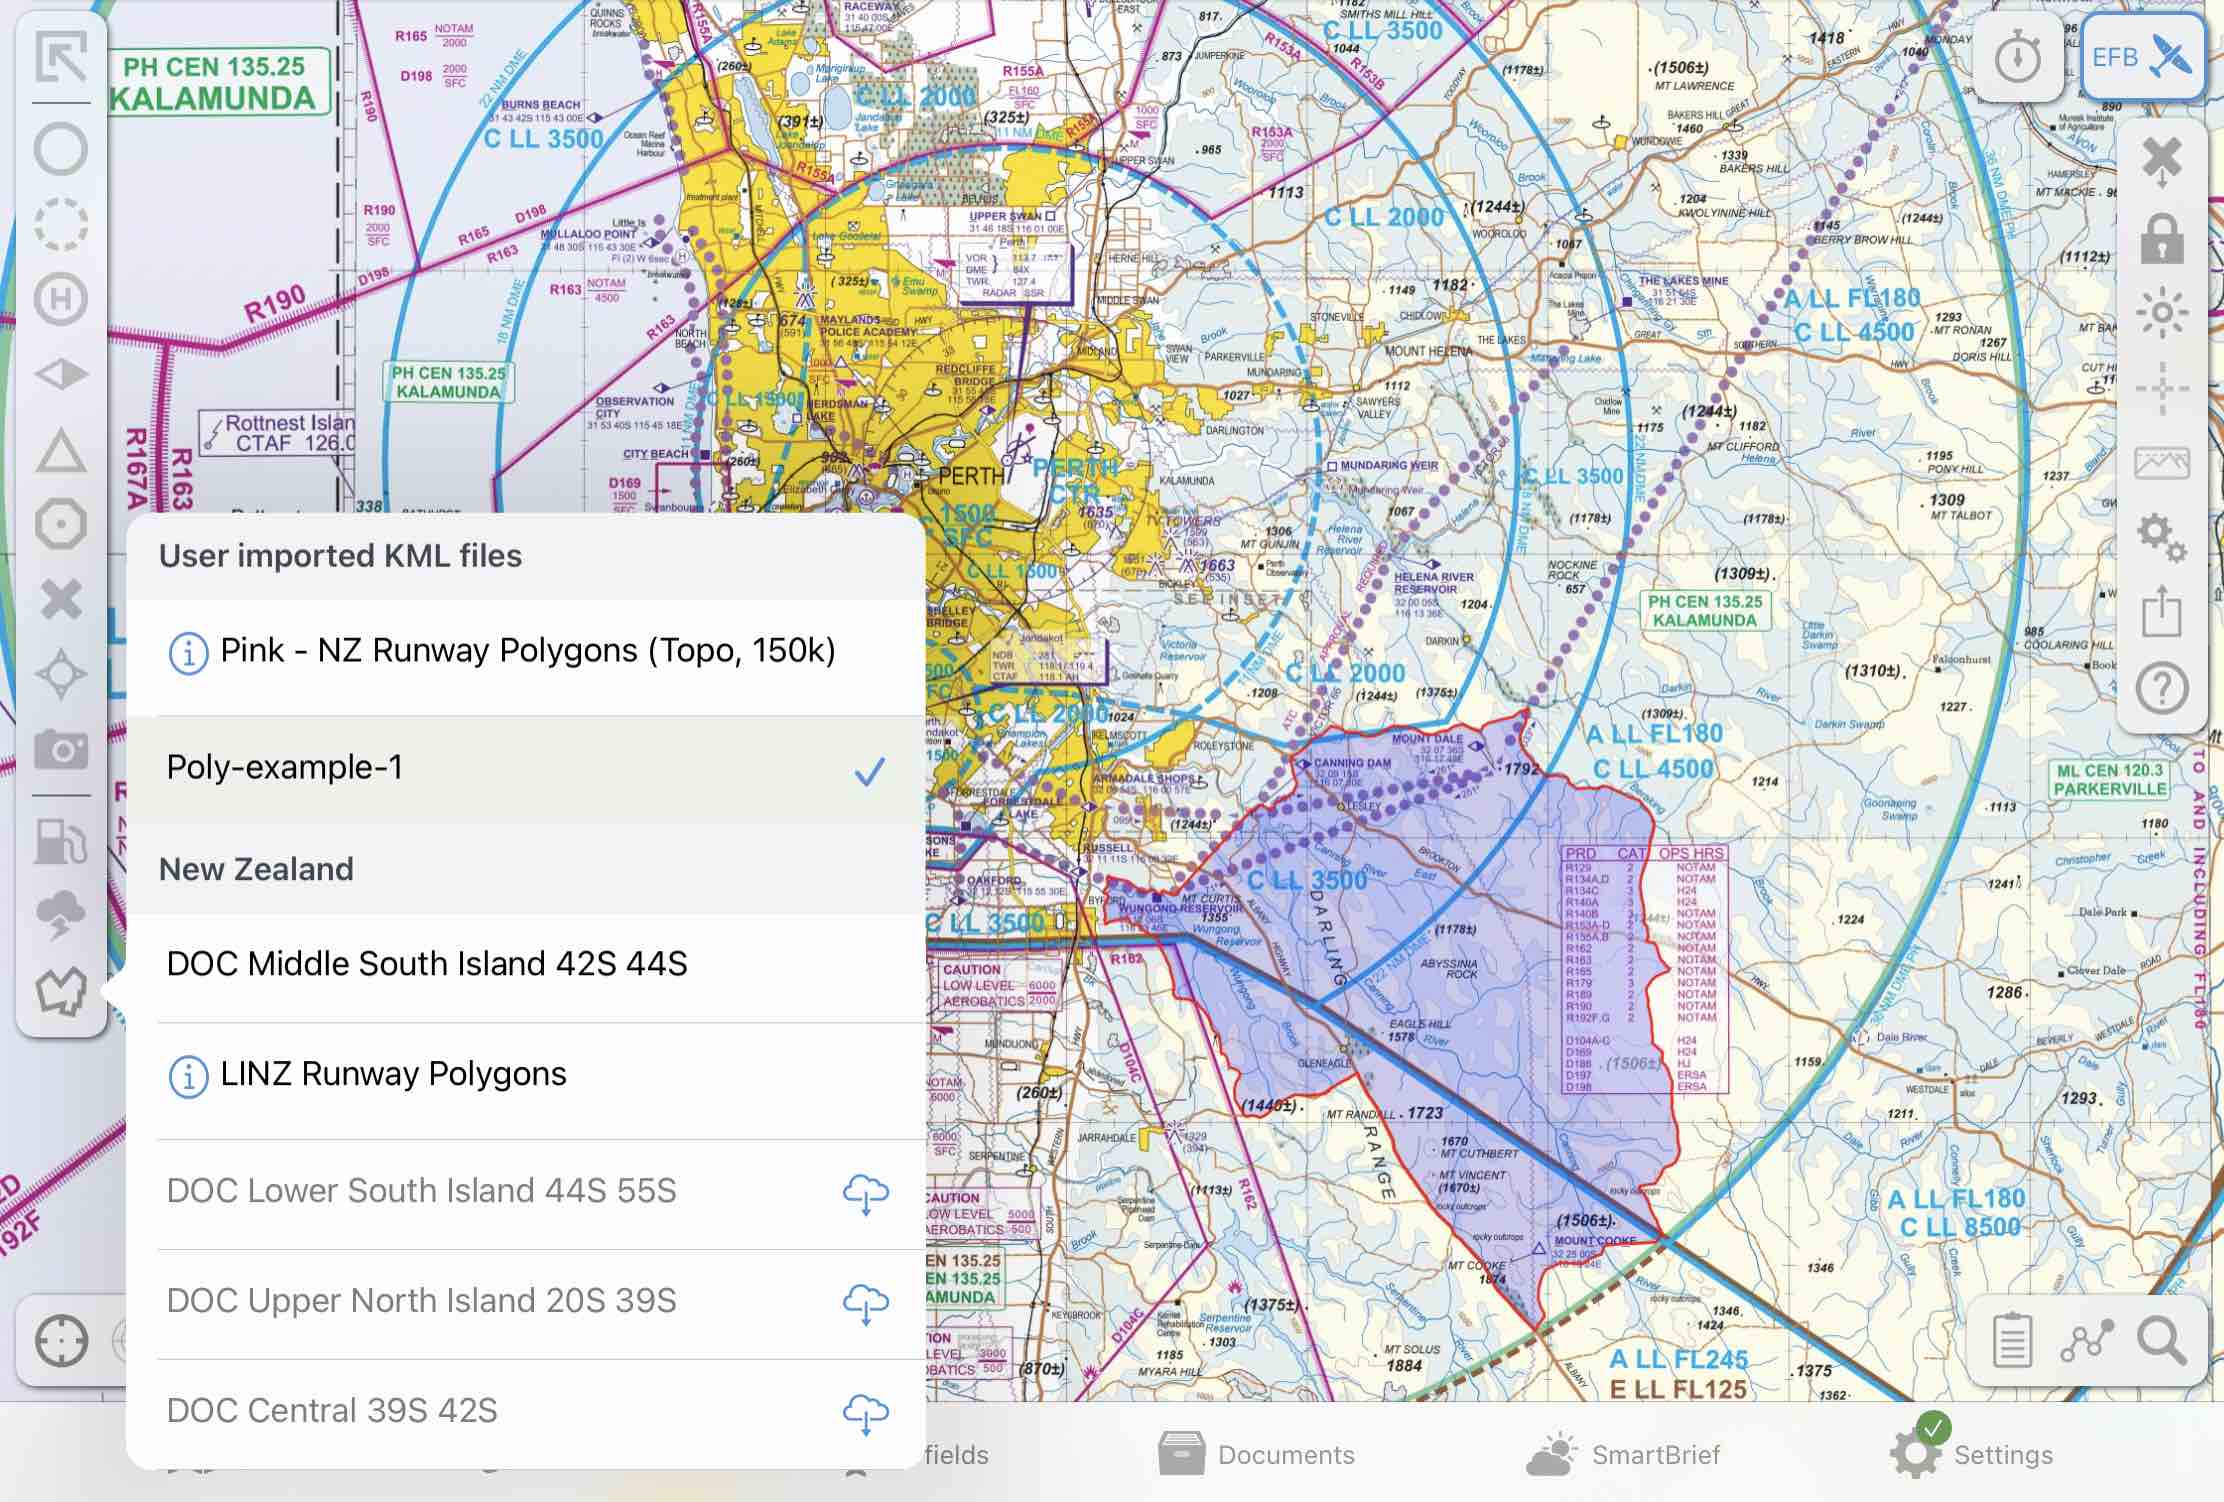
Image 17.1 Example KML overlay
17.2. Intro to KML
KML is an extensive language and has many features. OzRunways implements a subset of KML that allows basic graphical overlays. Specifically, OzRunways can deal with:
Placemarks (basically a location with a name)
Polygons (a shape with a colour)
Lines (an outline shape with colour and line thickness)
More complex shapes such as arcs and circles must be constructed from the above primitives. To review, in KML terms, currently, OzRunways deals with:
Styles (including StyleUrls)
LineStrings
Points
Polygons
Placemarks
17.3. KML Examples
Simple KML Placemark
The first example is a KML Placemark. It looks like this:
<?xml version="1.0" encoding="UTF-8"?>
<kml xmlns="http://www.opengis.net/kml/2.2">
  <Placemark>
    <name>YSTW</name>
    <description>Tamworth</description>
    <Point>
      <coordinates>150.84833,-31.08333,0</coordinates>
    </Point>
  </Placemark>
</kml>
A Placemark is the simplest KML object. It has a name, description and position (Point). Points are composed of coordinates which have longitude, latitude and altitude (150.84833,-31.08333,0) although OzRunways currently does not use the altitude. All KML files have some header information (the first two lines) and some after material (the last line). A field of interest is indicated by the field name (i.e. <name>) and the field is ended with a slash delimited version of the field name (i.e. </name>). The complies with a format called XML (Extensible Markup Language).
KML Placemark with Icon
A Placemark with an icon looks like this:
<?xml version="1.0" encoding="UTF-8"?>
<kml xmlns="http://www.opengis.net/kml/2.2">
  <Placemark>
    <name>YSTW</name>
    <description>Tamworth</description>
    <Style>
    <IconStyle>
    <scale>1.3</scale>
    <Icon>
  <href>http://maps.google.com/mapfiles/kml/shapes/airports.png</href>
    </Icon>
    <hotSpot x="32" y="2" xunits="pixels" yunits="pixels"/>
    </IconStyle>
  </Style>
    <Point>
      <coordinates>150.84833,-31.08333,0</coordinates>
    </Point>
  </Placemark>
</kml>
The <Style> statement adds an icon which is scaled 1.3 times from it’s base size. The icon comes from a Google collection although the web reference can be anywhere (i.e. you can define your own icons and use them). The ‘hotSpot’ parameter indicates where the icon may be tapped to display the name and description fields. The description field is HTML savvy so you can customise what information gets displayed when you tap on an icon (Placemark). This is extremely powerful and extensible and general purpose in nature. If you insert the description field then when you tap on the area, a popup will result. It has the side effect of shielding underlying waypoints. So if you have a large polygon but you wish to access waypoints underneath the polygon, omit the description field and place point items for identification (i.e. an icon).
KML Polygon
Next we show a KML Polygon. It looks like this:
<?xml version="1.0" encoding="UTF-8"?>
<kml xmlns="http://www.opengis.net/kml/2.2">
  <Document>
    <name>KmlFile</name>
    <Style id="transBluePoly">
      <LineStyle>
        <width>1.5</width>
      </LineStyle>
      <PolyStyle>
        <color>7dff0000</color>
      </PolyStyle>
    </Style>
    <Placemark>
      <name>YSTW Surround</name>
      <styleUrl>#transBluePoly</styleUrl>
      <Polygon>
        <outerBoundaryIs>
          <LinearRing>
            <coordinates>
              150.9,-31.1,0
              150.9,-31.2,0
              150.8,-31.2,0
              150.8,-31.1,0
              150.9,-31.1,0
            </coordinates>
          </LinearRing>
        </outerBoundaryIs>
      </Polygon>
    </Placemark>
  </Document>
</kml>
A polygon is defined as a list of coordinates as illustrated above. Styles can be defined at the start of the KML and referenced as ‘StyeUrls’ within particular polygons. The color field is a hex representation aabbggrr where aa is transparency, gg is green, bb is blue and rr is red. A hex value of ff (255) would indicate full intensity (1.0 on a scale of 0 to 1.0). A hex value of 80 would indicate a value of 0.5 or half intensity. The color show (7dff0000) is a slightly transparent blue line. (We use the US spelling for color, as that is how Google defines it …. naturally).
KML LineStrings
Next we show a KML LineString (line). It looks like this:
<?xml version="1.0" encoding="UTF-8"?>
<kml xmlns="http://www.opengis.net/kml/2.2">
<Document>
<name>KmlFile</name>
<Style id="transPurpleLineGreenPoly">
    <LineStyle>
      <color>7fff00ff</color>
      <width>4</width>
    </LineStyle>
    <PolyStyle>
      <color>7f00ff00</color>
    </PolyStyle>
  </Style>
  <Placemark>
    <name>Absolute</name>
    <description>Transparent purple line</description>
    <styleUrl>#transPurpleLineGreenPoly</styleUrl>
    <LineString>
<coordinates>
150.9,-31.1,0
150.9,-31.2,0
150.8,-31.2,0
150.8,-31.1,0
150.9,-31.1,0
</coordinates>
    </LineString>
</Document>
</kml>
LineStrings have a style and a list of coordinates. Through the style you can set the colour and thickness of the line.