8. Weather
8.1. Quick Briefing
Weather for a specific aerodrome can be accessed by tapping on the map near the waypoint of interest, tap on the waypoint in the resulting Closest Points popup, then tap Quick Briefing. In some cases you may see a weather icon shortcut for the top result in the Closest Points popup. Tap this to achieve the same result.
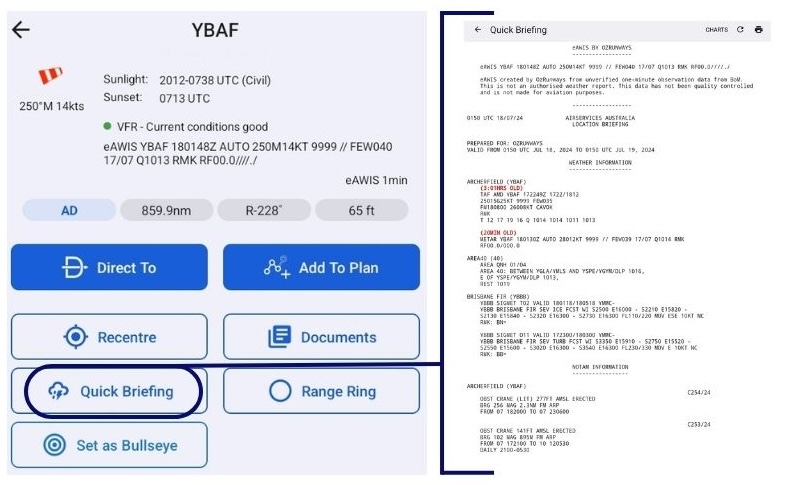
Image 8.1 Quick Briefing
At the top of the Quick Briefing page there is a button to open the Chart Browser where you can find the GAFs and GPWTs relevant to the area of the selected waypoint, a reload button to fetch a new location briefing, and a button to print the briefing.
Where available, the eAWIS is displayed at the top of the briefing, followed by a typical NAIPS Aisrservices Australia location briefing, including weather and NOTAM infromation applicable to the waypoint area.
eAWIS by OzRunways uses the one-minute observation data from the Bureau of Meteorology, available at locations with an Aerodrome Weather Station. Presented similar to a METAR but updated every minute. eAWIS is created from unverified one-minute observation data from BoM. For situational awareness only.
Naturally, TAFs or NOTAMs are not displayed for locations that have none.
8.2. Weather Overlay
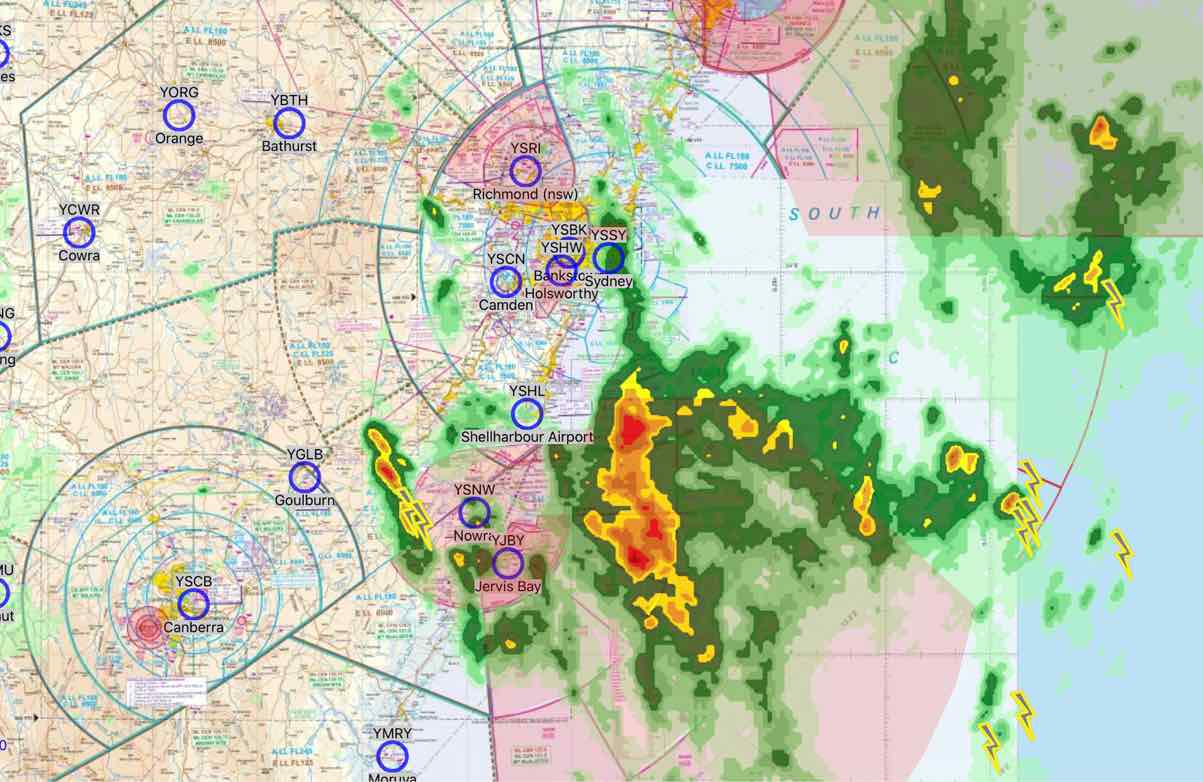
Image 8.2 Weather Overlay
The overlay is a weather radar feed that is overlaid on whichever map you are viewing. The overlay shows rain, clouds and lightning.
The Weather Overlay is turned on/off on the Range Ring on the Map Page
When switching on the Weather Radar Overlay, the radar data will be fetched on-demand from the internet. Until the data can be loaded a set of boxes with red crosses are shown. As the data downloads the boxes will disappear and be replaced with the radar data. This makes it easy to distinguish between areas that have no weather, and areas where the data has not been downloaded yet.
Image 8.2 shows a typical overlay with both lightning and rain. The intensity of the rain is graded from light green, through yellow, to red, purple and eventually, white. There are three cycles of animation to show the direction of weather. Significant cloud overlays are also shown in grey. A table that shows colour to rainfall can be found at https://en.wikipedia.org/wiki/DBZ_(meteorology).
8.3. MetEye / Satview / Windy
These items are accessed by pressing the Radar button on the Map Page. Use the controls at the top to switch between MetEye / Satview / Windy
MetEye
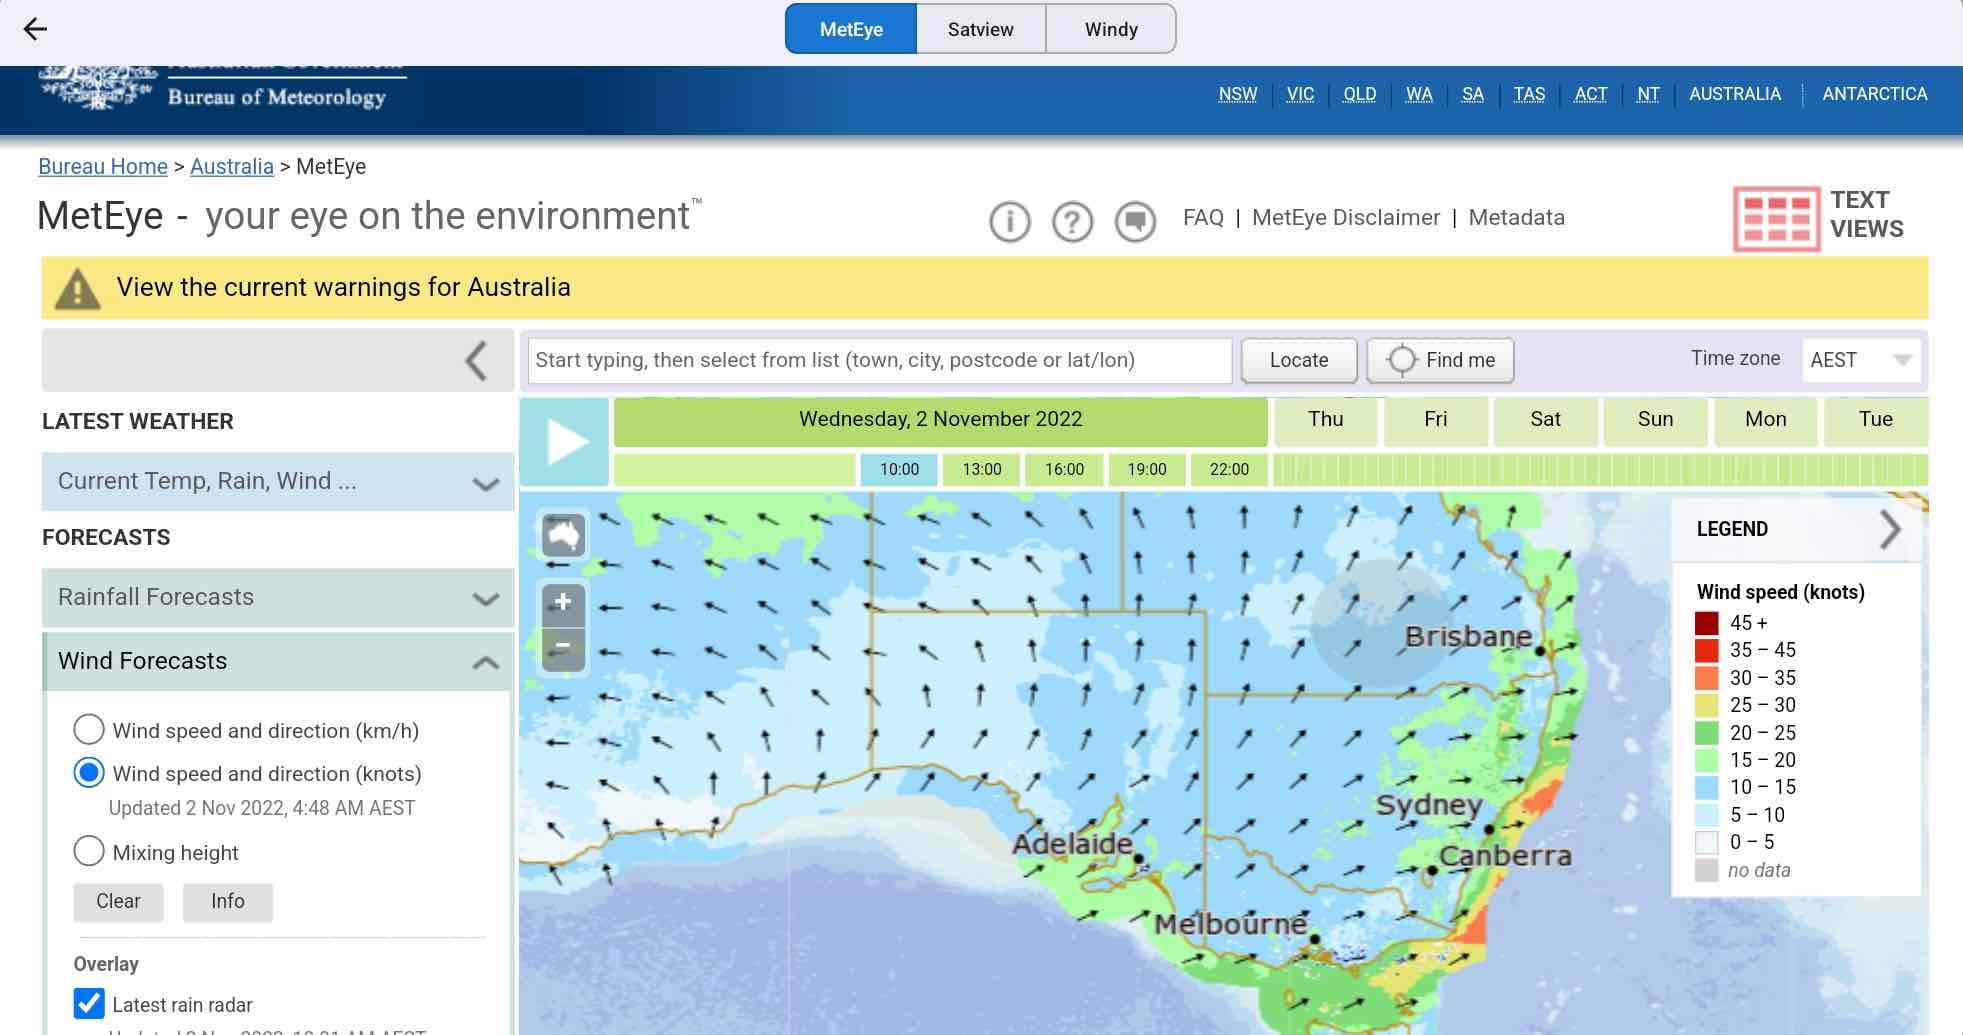
Provides access the Bureau of Metereology MetEye feature. Visit the MetEye website for more infromation: http://www.bom.gov.au/australia/meteye/
Satview
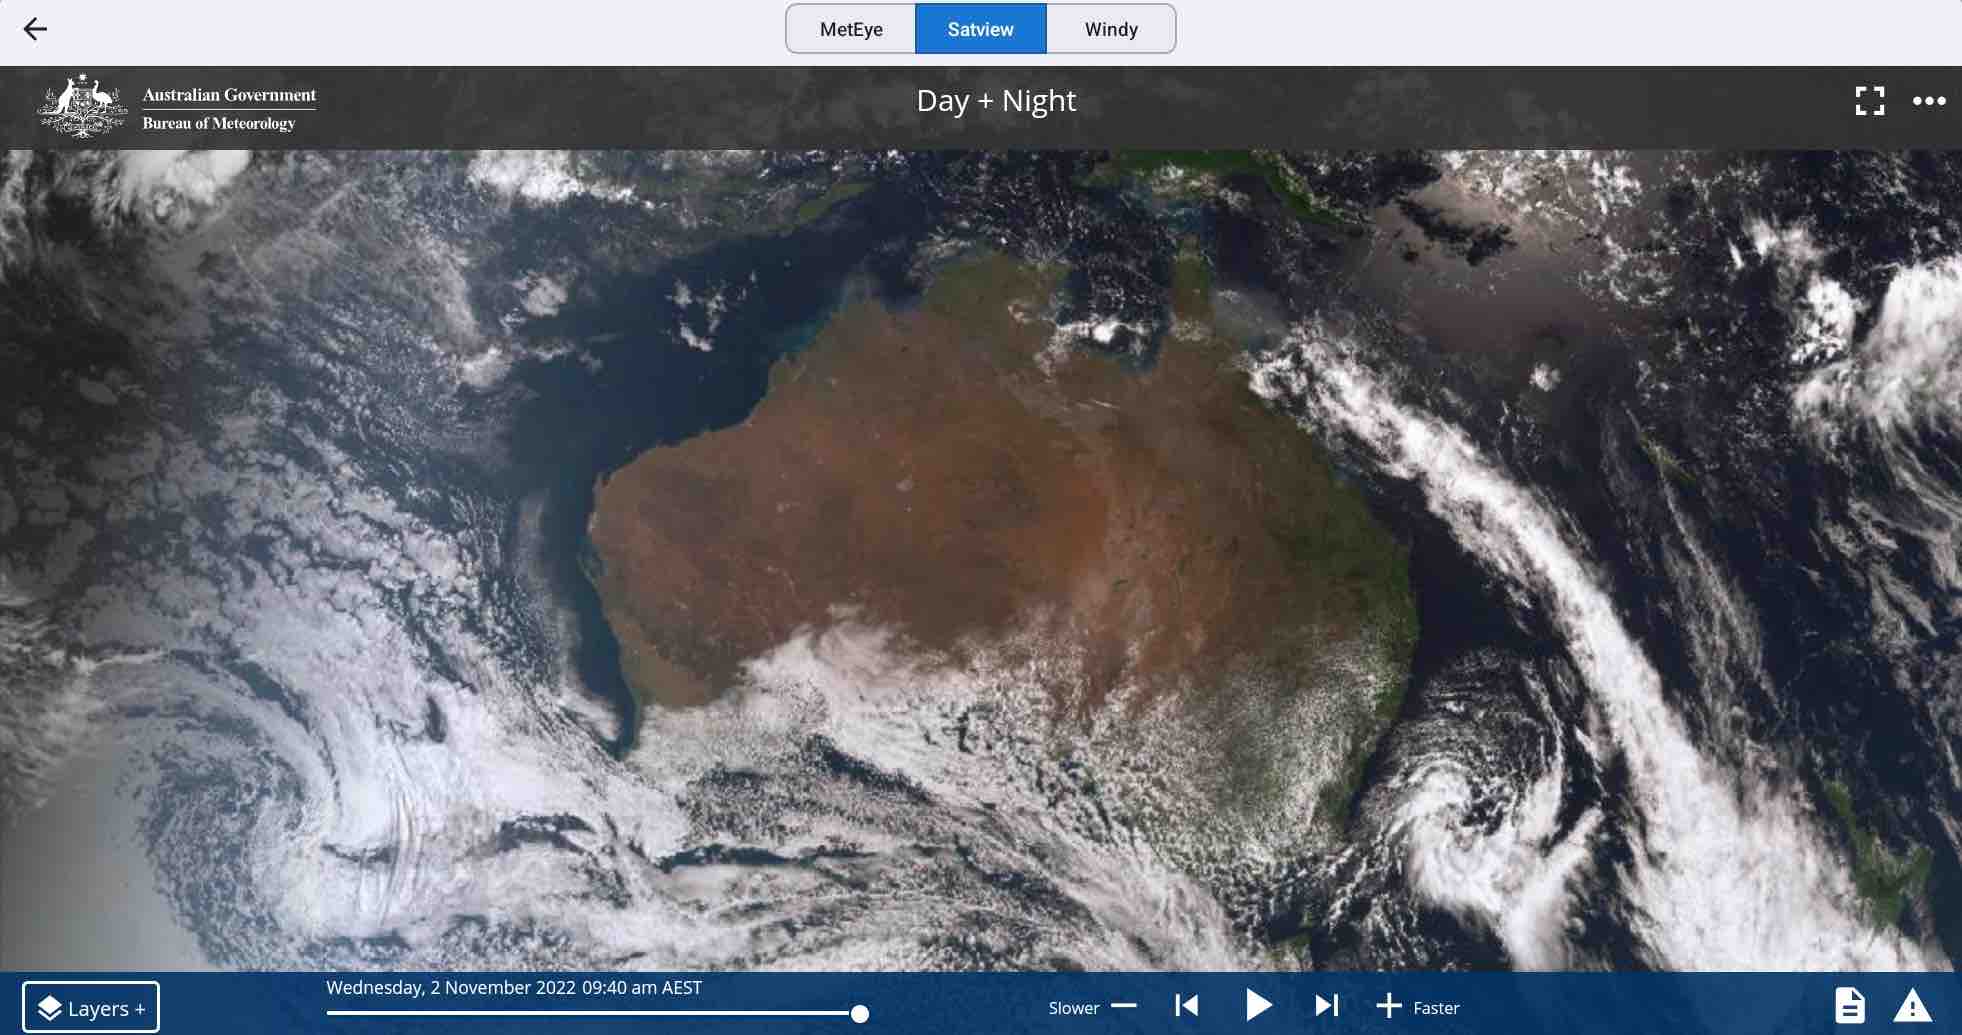
This satellite view is from the Bureau of Meteorology website: http://satview.bom.gov.au Press the Play button to see the time lapse images, spaced 10 minutes apart for 4 hours. Selecting the Layers button in the bottom left hand corner enables you to activate multiple features such as Lightning, Cities, Roads, and more.
Windy.com
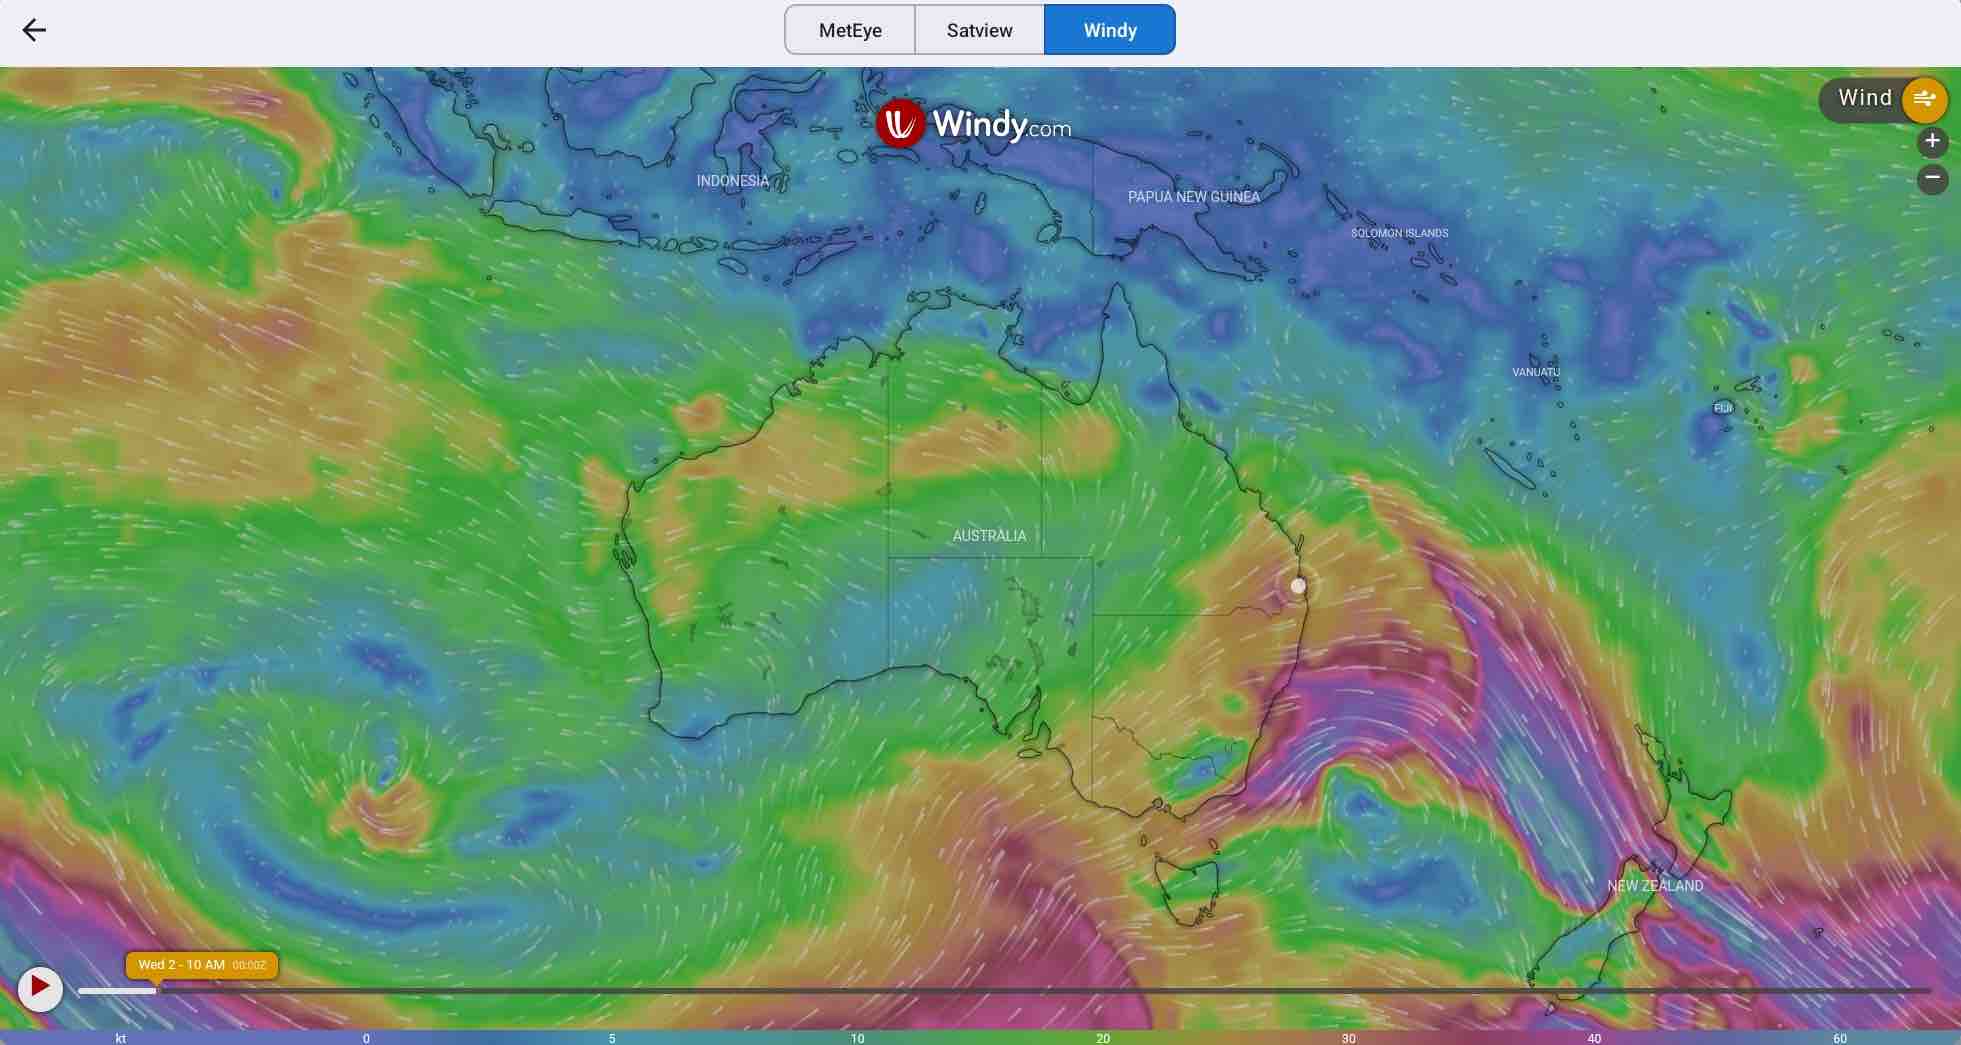
Windy is a forecast tool. The time of the forecast can be advanced using a menu at the bottom of the display. Wind, cloud, temperature, rain (and snow), and atmospheric pressure may be displayed (and forecast). In addition, where appropriate, the altitude may be set. Windy is a private company that accesses a publicly available weather database produced by worldwide weather agencies (including the BoM) that provides forecasts into the future on a grid basis (i.e. one latitude degree by one longitude degree).
The label in the top right hand corner shows what information is currently being overlaid on the map. Tap on the label to reveal more options. Here you can choose from a variety of overlays, and also adjust the forecast altitude and other settings. Tap on the Windy map and a picker will appear. This picker will show the exact weather at this point, depending on the displayed overlay. For example if the Wind overlay is enabled, the picker will show the wind direction and speed at this point.
8.4. Brief / SmartBrief
SmartBrief is an interactive map that combines a variety of different weather sources. You can access the Graphical Area Forecasts (GAF), NAIPS location briefings, SIGMETs, AIRMETs, Grid Point Wind & Temperature (GPWT) and more. For more information about SmartBrief see the Brief (or SmartBrief) Page